
App Analytics Part 1: Custom Events
/I have never done much with analytics in my apps in the past. This is not, however, because I don’t think it’s important or useful.
My problem with analytics is that it’s overwhelming. There is so much data available, a lot of times I don’t know what I need to track. However, I see my lack of knowledge as a fantastic excuse to learn through experimentation.
In app analytics
The driving force behind wanting to track events from within my apps was to improve the quality of the apps themselves.
While working on Stories, Alice and I were making a lot of design decisions based on instinct and based on a limited number of beta testers.
We spent a lot of time agonizing over details like how to best introduce new vocabulary, how to make the stories more engaging, and whether or not features were discoverable.
Instead of guessing, we wanted real numbers. This led us to add analytics to track the things we were curious about.
Expectations of our users
The first thing we wanted to track was user expectation.
The goal is to make each scene in our stories highly interactive. This keeps the users engaged and curious to discover what else the app can do.
For instance, in our Goldilocks and the Three Bears story, tapping on the clock in the background causes the clock to quickly advance 12 hours. In the same scene, tapping on the logs in the fireplace briefly lights a fire.[1]
However, playing with our own stories day in and day out, we’ve developed a perspective that’s too close to the issue. We needed to see where real, actual users expected to be able to interact with the scene.
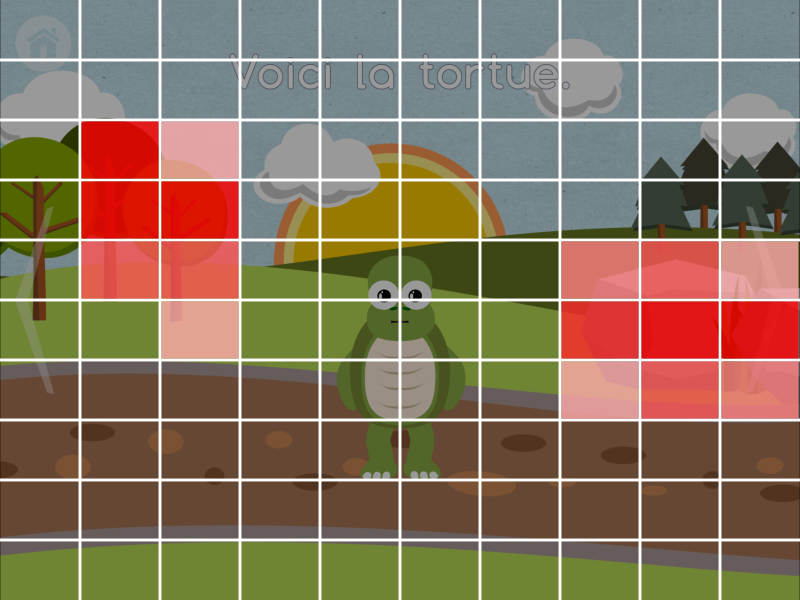
For instance, if enough users tapped on a rock in the scene but nothing happened, we wanted to know. We would then have the option to add an interactive component to the rock via a future update.
Since, a non-interactive part of the scene was, generally, something baked into the background, I couldn’t just report which items were being tapped. I also couldn’t just report every single touch location. That could be an overwhelming amount of data.
My solution was to break up the screen into a 10 x 10 grid and keep track of which squares were tapped.
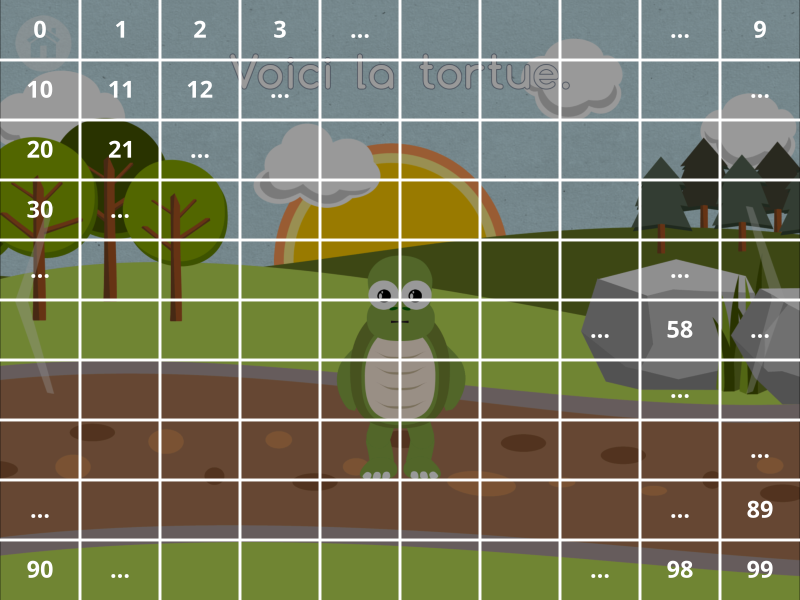
From this I wanted to create a heat map across all users for each scene.
Custom events
For this to work, I figured I could use Fabric’s custom events to track the scene number and the grid number tapped. Additionally, I would need the screen resolution, as that would change the shape of the grid squares. I cannot directly compare iPhone taps to iPad taps without conversion first.
The way custom events work, you give an event a custom name and pass in a dictionary of custom attributes.
Perfect. I could do something like this:
Answers.logCustomEventWithName("Tapped",
		customAttributes: [
			"scene": 22,
			"grid": 58,
			"width": 1024,
			"height": 768])
Right? Nope.
Well I could, but it turns out that each of the key value pairs in the attributes dictionary are aggregated vertically[2] together.
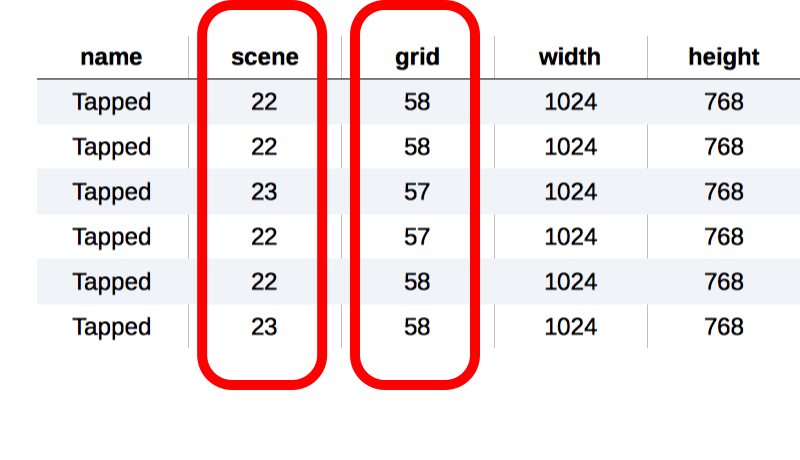
This means that instead of finding out I got 100 taps on grid 58 of scene 22 for a resolution of 1024 x 768, I might get that the median scene tapped was 22 and the median grid tapped was 58, etc…
Not exactly useful.
I emailed Fabric’s support team to find out if they had a way to visualize the data differently. The answer I got:
Everything you’ve asked for is in the eventual roadmap, but not something that can be done at the moment. The best solution we’ll likely release in the near future is a way for you to download your data as a CSV so you can do some manipulation in R or another program you use for data analysis. More sophisticated visualizations based on attribute data are definitely in the planning though- we’ll keep you posted!
This was on August 26, 2015. As far as I can tell, the ability to download a CSV with each event is still not available. I can download CSVs for general metrics, like event counts or number of event users, but not one with the custom attributes for each event sent.
Temporary (?) solution
One thing I am going to try is converting my custom attributes dictionary from above to the following:
Answers.logCustomEventWithName("Tapped",
		customAttributes: ["scene 22, 1024 x 768": "grid 58"])
This would group all taps for scene 22 on a 1024 x 768 screen together. By making the value in the dictionary a string instead of a number, Fabric would give me counts of those events instead of trying to average them together.
I’m not completely happy with this, but it might be the best solution I available to me so far.
I still need to find a way to get the data out of Fabric and into a script that will create a heat map for me…
What next?
This was a good way to start experimenting with analytics. I made some assumptions, discovered they were wrong, and corrected based on what I learned. I have some more lessons learned I want to share, but as this post was getting long, I’ll save them for another post.[3]
I am still learning, so if you have any suggestions or know something I’m clearly missing, please find me on Twitter and let me know. I’m @yonomitt.
Have a nice day,
Yono