
App Analytics Part 2: More Custom Events
/This is a followup to my last post on app analytics with a couple more gotcha examples[1] I ran into. I originally wanted to include them in the last post, but it was getting a little long.
Time measurement issues
An activity in Stories can be categorized as a lesson, review, story, or game. One thing that really interests us is how long our users spend in each type of activity on a per story pack basis.[2]
If very little time is spent, for instance, in a particular game, we want to know. It could be sign the game is either too hard, too easy, or not at all fun. It would also act as a reference for us to see positive and negative impacts of updates we push to the AppStore.
That in mind, my first attempt was a complete and utter failure. Much like with the Tapped event example in the previous article, I initially created an attribute dictionary that looked something like:
let lessonNumber: Int = ...
let timeInSeconds: Int = ...
let attrs = ["Lesson Number": lessonNumber, "Time": timeInSeconds]
Seems logical, right?
But can you spot the problem with how Fabric is going to display this data?
Fabric will aggregate each key-value pair into separate graphs. Numerical values in the attribute dictionary are graphed versus the date collected, while string values are counted up.
Doing this, I got one graph plotting lesson number on the y-axis versus the date on the x-axis and one graph plotting time versus the date.
The second graph sounds ok on the surface, but thinking about it further, it’s an aggregation of time spent in all lessons over time. I wanted time per lesson.
Completely. Utterly. Useless.
To be fair, I was thinking about this all wrong. My fallacy was assuming a dictionary with two key-value pairs would be interpreted as a two axes graph. Had I stopped to think about what would happen if there were more than two entries in the dictionary, maybe I could have avoided this unnecessary issue. Then again, maybe not…
A solution
The way I’ve fixed this, which seems fine for now, is to build my attribute dictionary slightly differently.
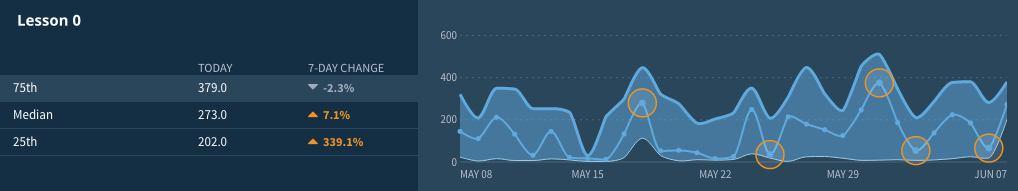
let attrs = ["Lesson \(lessonNumber)": timeInSeconds]
This produces graphs more like what I need:
Feature discoverability
Alice and I were also curious about the discoverability of some of the key features of the app. One feature, in particular, is the ability to swipe horizontally and vertically in the interactive lesson.

My first attempt to log the horizontal and vertical swipes looked like this:
let num: Int = ...
let vertSwipeCount: Int = ...
let horizSwipeCount: Int = ...

let eventName = "Interactive Lesson Swipes"
let attrs = ["Interactive Lesson Num": num, "Vertical": vertSwipeCount, "Horizontal": horizSwipeCount]
This did not work. Again, all the lesson numbers were aggregated together as were the vertical and horizontal swipe counts. While this gives a little bit of information, as we now knew whether there were any swipes, it wasn’t fine-grain enough for what we needed.
Again, I’m not sure why I thought Fabric could intuit information about my data. How are they supposed to know that those three entries could be grouped nicely into two groups of two? I was too close to it to see there could be other interpretations.
Another solution
I chose to fix this particular issue by breaking out the custom event into two separate events.
let vertEventName = "Interactive Lesson Vertical Swipes"
let horizEventName = "Interactive Lesson Horizontal Swipes"
let vertAttrs = ["Interactive Lesson \(num)": vertSwipeCount]
let horizAttrs = ["Interactive Lesson \(num)": horizSwipeCount]
I could have used a single event such as:
let attrs = ["Interactive Lesson \(num): Vertical": vertSwipeCount, "Interactive Lesson \(num): Horizontal: horizSwipeCount]
However, due to the number of different interactive lessons in the app, it would be more organized to separate the events.
Drawbacks
One thing that still frustrates me is the lack of access to the raw data. Through their dashboard, I can see graphs of recent data, but only the last 30 days. I still can’t download a CSV file with all of my events.[3]
Both of these combined means that if I want to reinterpret my data later, I’m out of luck.
If Stories were to become popular enough, I may look into rolling my own analytics engine and server to gather the data I need. Unless, that is, I learn about a different product that can serve my needs. Or unless Fabric updates their product. Please?[4]
Thanks for reading. If you have a comment, feel free to ping me on Twitter. I’m always happy to learn from others.
I’m @yonomitt.
Have a nice day,
Yono
-
That’s a technical term ↩
-
A story pack is a collection of activities centered around the theme of a single story, such as The Three Little Pigs. It’s the top level of hierarchy in the app. ↩
-
If there is a way to do either, please let me know! ↩
-
Overall I do like Fabric. It’s almost everything I need. ↩